Clips, live shows and their replays include a detailed content level analytics section, which can be found in the General tab of the individual content panel. Important KPIs are displayed directly in the panel, and additional more detailed reports are available for download.
Clip & Show Analytics
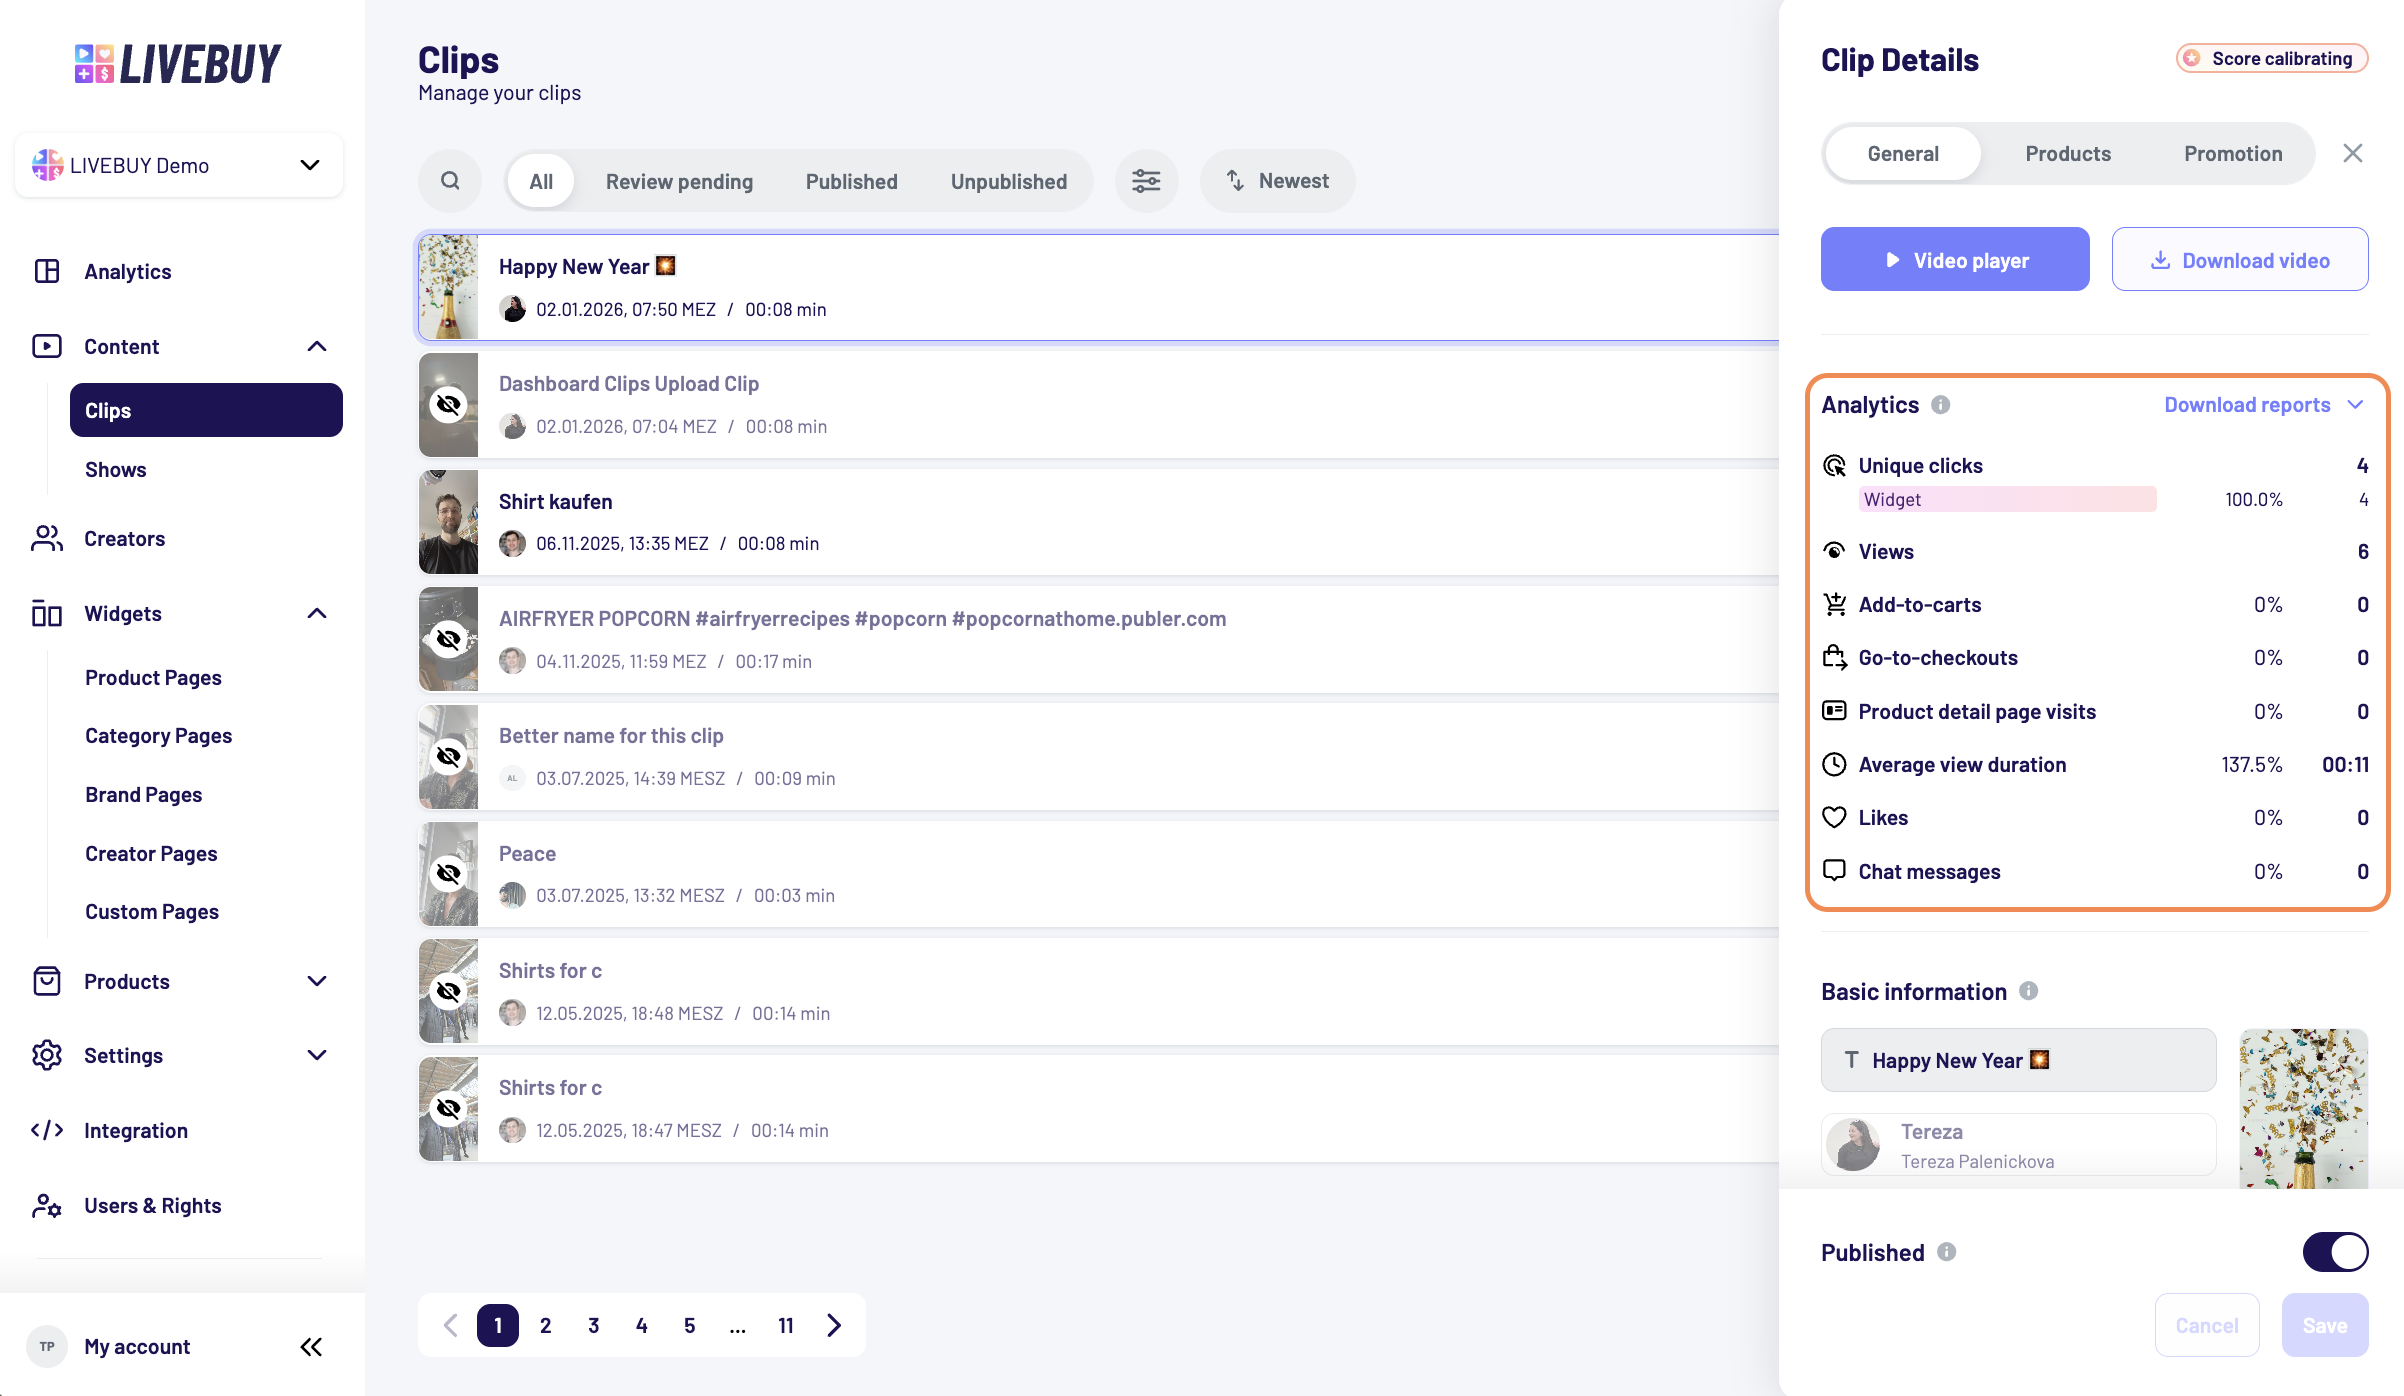
Displayed KPIs
|
KPI |
Explanation |
|---|---|
|
Unique Clicks |
Total unique clicks that opened the video player (including click sources if available).
|
|
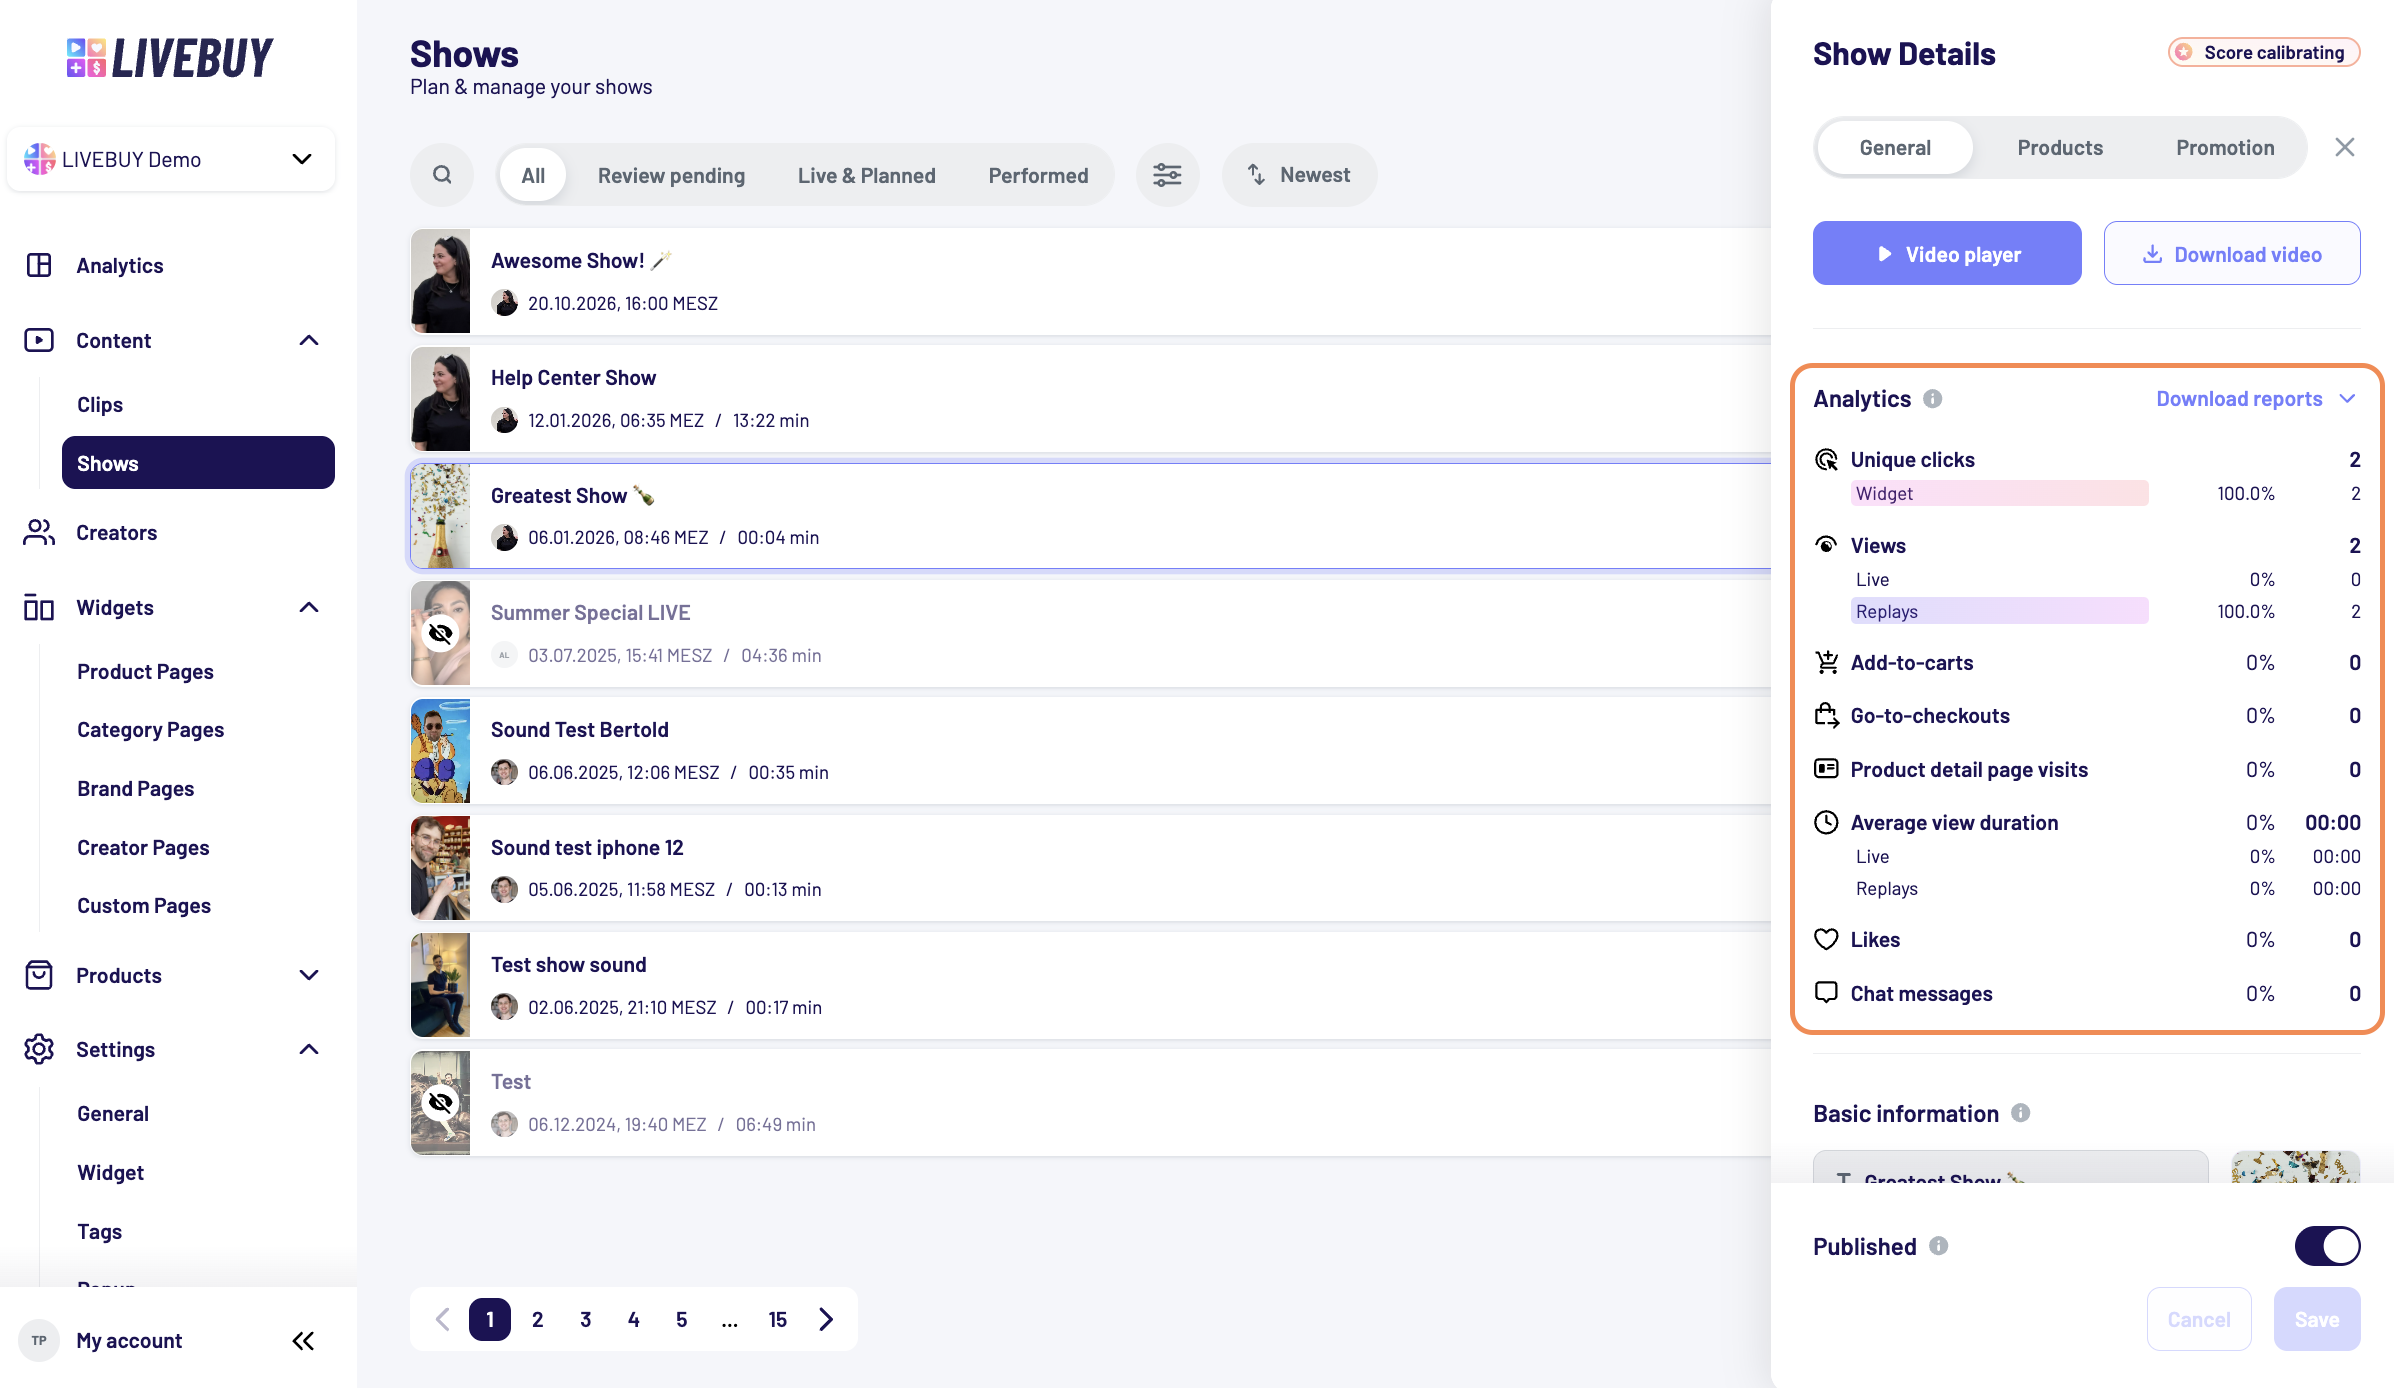
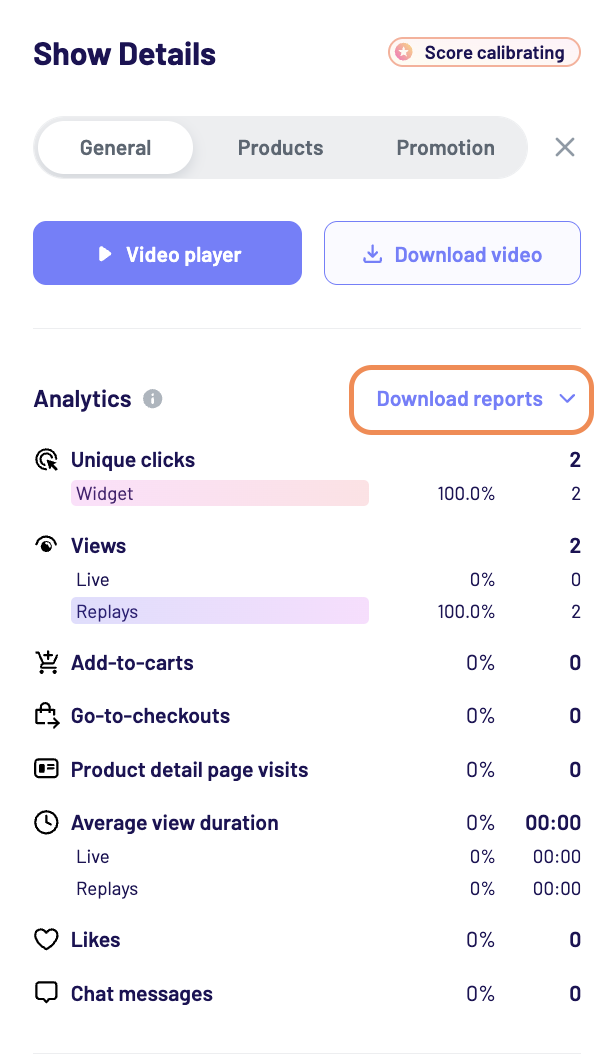
Views |
Number of unique viewers. For live shows, live and replay views are shown separately. |
|
Add-to-Carts |
Number of products added to the cart. Percentage is relative to views. |
|
Go-to-Checkouts |
Clicks on the “Checkout” button. Percentage is relative to add-to-carts. |
|
PDP Visits |
Visits to product detail pages. Percentage is relative to views. |
|
Average View Duration |
Average watch time in MM:SS. Percentage is relative to total content duration. For live shows, live and replay views are shown separately. |
|
Likes |
Number of likes received. Percentage is relative to views. |
|
Chat Messages |
Total chat messages sent during the show. Percentage is relative to views. (Available for live shows only.) |
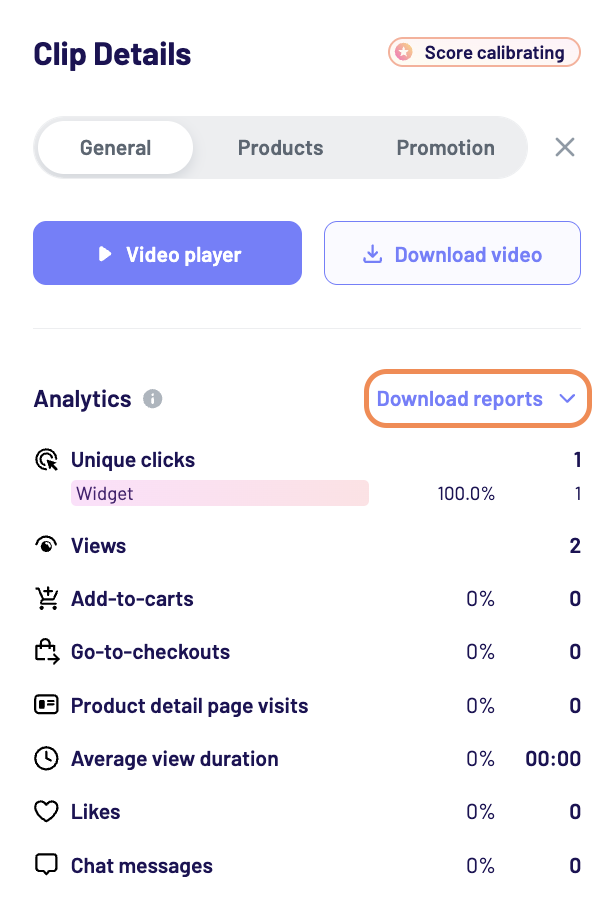
Downloadable Reports
For each produced clip or performed live show and its replay you can download individual analytics reports as CSV files directly from the dashboard.
These reports provide deeper insights beyond the on-screen KPIs and are especially useful for performance analysis, reporting, and optimization.
You can find those reports in the General Tab of the individual clip or show panel.
Clips - Downloadable Analytics (CSV)
-
Clip statistics
Includes clip metadata, replay views, watch time, engagement, and commerce KPIs. -
Source and referrer
This report provides insights into where viewers came from and how they accessed the content.
It includes the number of unique viewers per source. Please see below the available sources.
Shows - Downloadable Analytics (CSV)
-
Show statistics
Includes show metadata, viewer counts, engagement metrics, chat activity, and commerce KPIs. -
Chat history
This report contains the full chat history of a show.
It is useful for reviewing viewer questions, engagement, and moderation activity. -
Distribution of live viewers
This report shows how many viewers were watching at the same time throughout the duration of a show.
It helps identify engagement peaks and drop-off moments. -
Replay statistics
Includes replay views, watch time, engagement, and commerce KPIs. -
Source and referrer
This report provides insights into where viewers came from and how they accessed the content.
It includes the number of unique viewers per source. Please see below the available sources.
KPI Definitions (Clip, Live Shows and their Replays Statistics)
Below is an overview and explanation of the KPIs included in the Clip / Show / Replay Statistics reports:
|
KPI |
Explanation |
|---|---|
|
Billable Views |
The number of viewers who watched for at least 10 seconds and are billed by LIVEBUY. |
|
Peak Concurrent Viewers |
The highest number of viewers watching the content at the same time. |
|
Total Unique Viewers |
The total number of individual viewers who tuned in, including viewers who watched for less than 10 seconds. |
|
Total Views Initiated |
The total number of times the video player was opened before the show started and during the live show.
|
|
Total Chat Joins |
The number of viewers who joined the chat, including viewers who did not send a message. |
|
Unique Chat Participants |
The number of unique viewers who joined the chat. |
|
Chat Messages Sent |
The total number of chat messages sent during the show. |
|
Average View Duration |
The average time viewers spent watching the content. |
|
Practice View Counts |
The total number of viewers who watched practice runs (Pro Setup shows only). |
|
Average Practice View Duration |
The average watch time during a practice run. |
Source & Referrer Report
Available Sources
-
Widget
The clip or show was opened from a LIVEBUY widget. -
Show Trigger
The content was opened via a show trigger in your shop. -
Pop-up
The content was opened through an activated pop-up in your shop. -
Autoplay Link
The content was opened using an autoplay link (e.g. shared links or add-to-calendar links). -
Custom
The content was opened via a custom integration using the LIVEBUY API. -
Dashboard
The player was opened directly in the dashboard (e.g. by moderators or dashboard users).
Additional information for Source & Refferer Report: UTM Parameters
You can also track viewer sessions using UTM parameters.
Example:
By adding utm_source=instagram to an autoplay link URL, you can measure how many viewers joined the content from Instagram.
This allows you to evaluate the performance of marketing campaigns and external traffic sources in detail.
For questions about analytics or downloadable reports, please reach out to your Key Account Manager or our Support team.